9.2 K-means Clustering
Another popular machine learning technique is k-means clustering. It seeks to group your data into a fixed number of clusters based on a measure of distance. An important pre-processing step to clustering is the center and scale your data.
cats <- cats %>%
  mutate(scale_weight = as.numeric(scale(weight)),
         scale_wander = as.numeric(scale(wander_dist)),
         scale_age = as.numeric(scale(age)))
We use the kmeans function to perform the clustering, and need to pass it a data frame, the number of centers we want, and another argument nstart, which helps get around some numerical issues if the algorithm gets stuck in a local extrema.
cats_cluster <-
  kmeans(x = cats %>% dplyr::select(scale_weight, scale_wander, scale_age),
         centers = 3,
         nstart = 20)
str(cats_cluster)
cats_cluster$centers
We can use ggplot to visualize the clusters.
cats$cluster <- factor(cats_cluster$cluster)
cluster_centers <- as.data.frame(cats_cluster$centers)

ggplot(data = cats) +
  geom_point(aes(x = scale_age, y = scale_weight, color = cluster), size = 4) +
  geom_point(data = cluster_centers, aes(x = scale_age, y = scale_weight), color = 'black', size  = 8) +
  theme_bw(base_size = 18)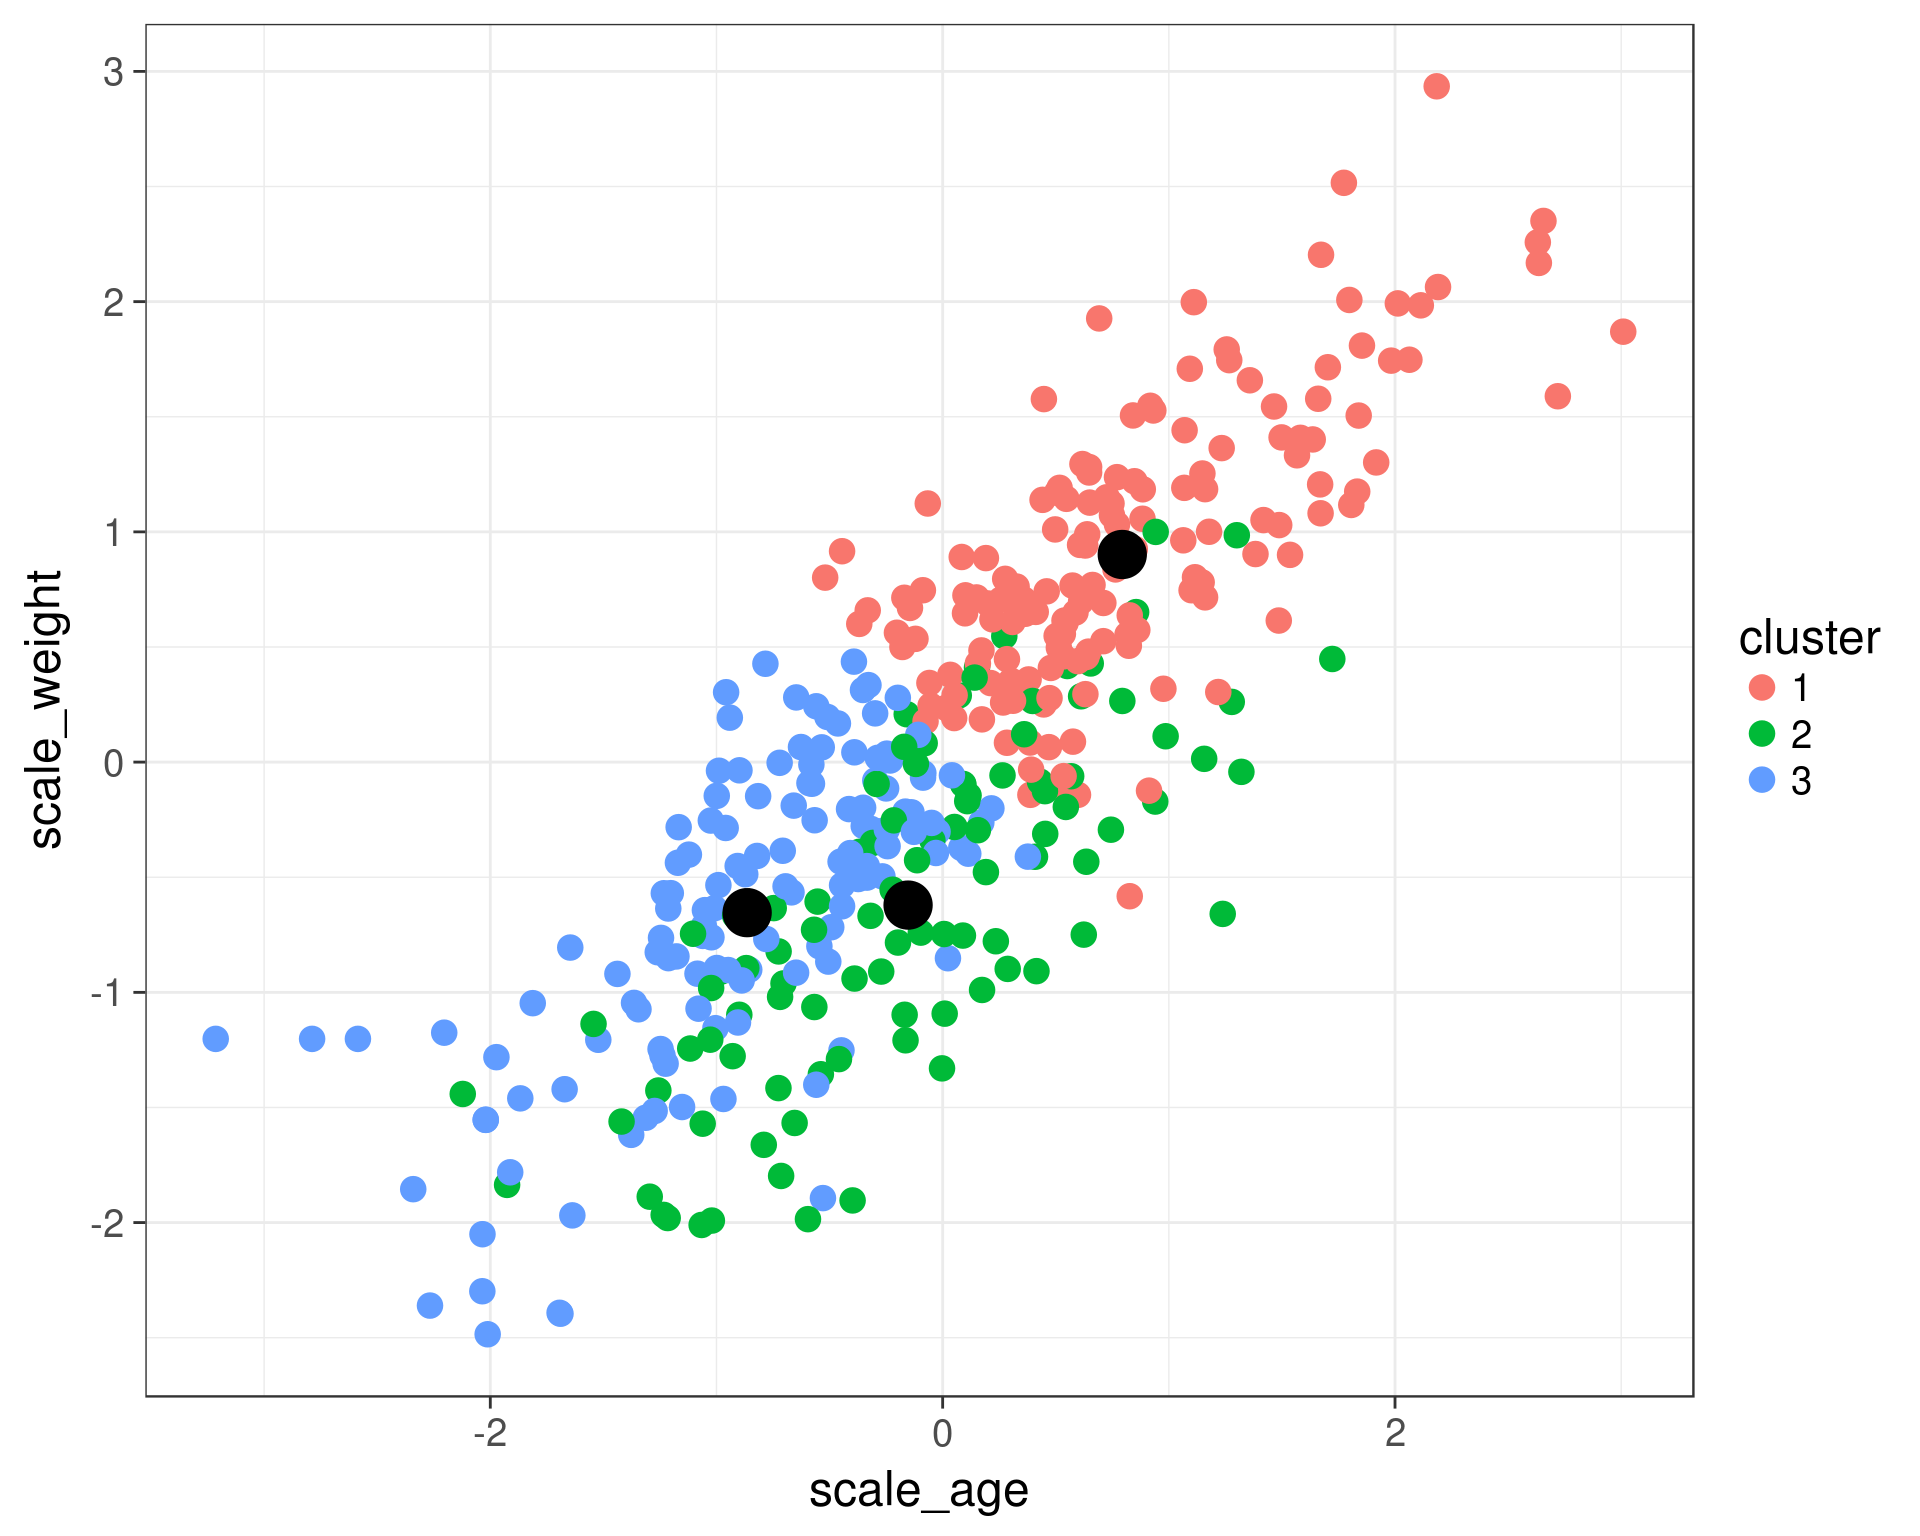
ggplot(data = cats) +
  geom_point(aes(x = scale_age, y = scale_wander, color = cluster), size = 4) +
  geom_point(data = cluster_centers, aes(x = scale_age, y = scale_wander), color = 'black', size  = 8) +
  theme_bw(base_size = 18)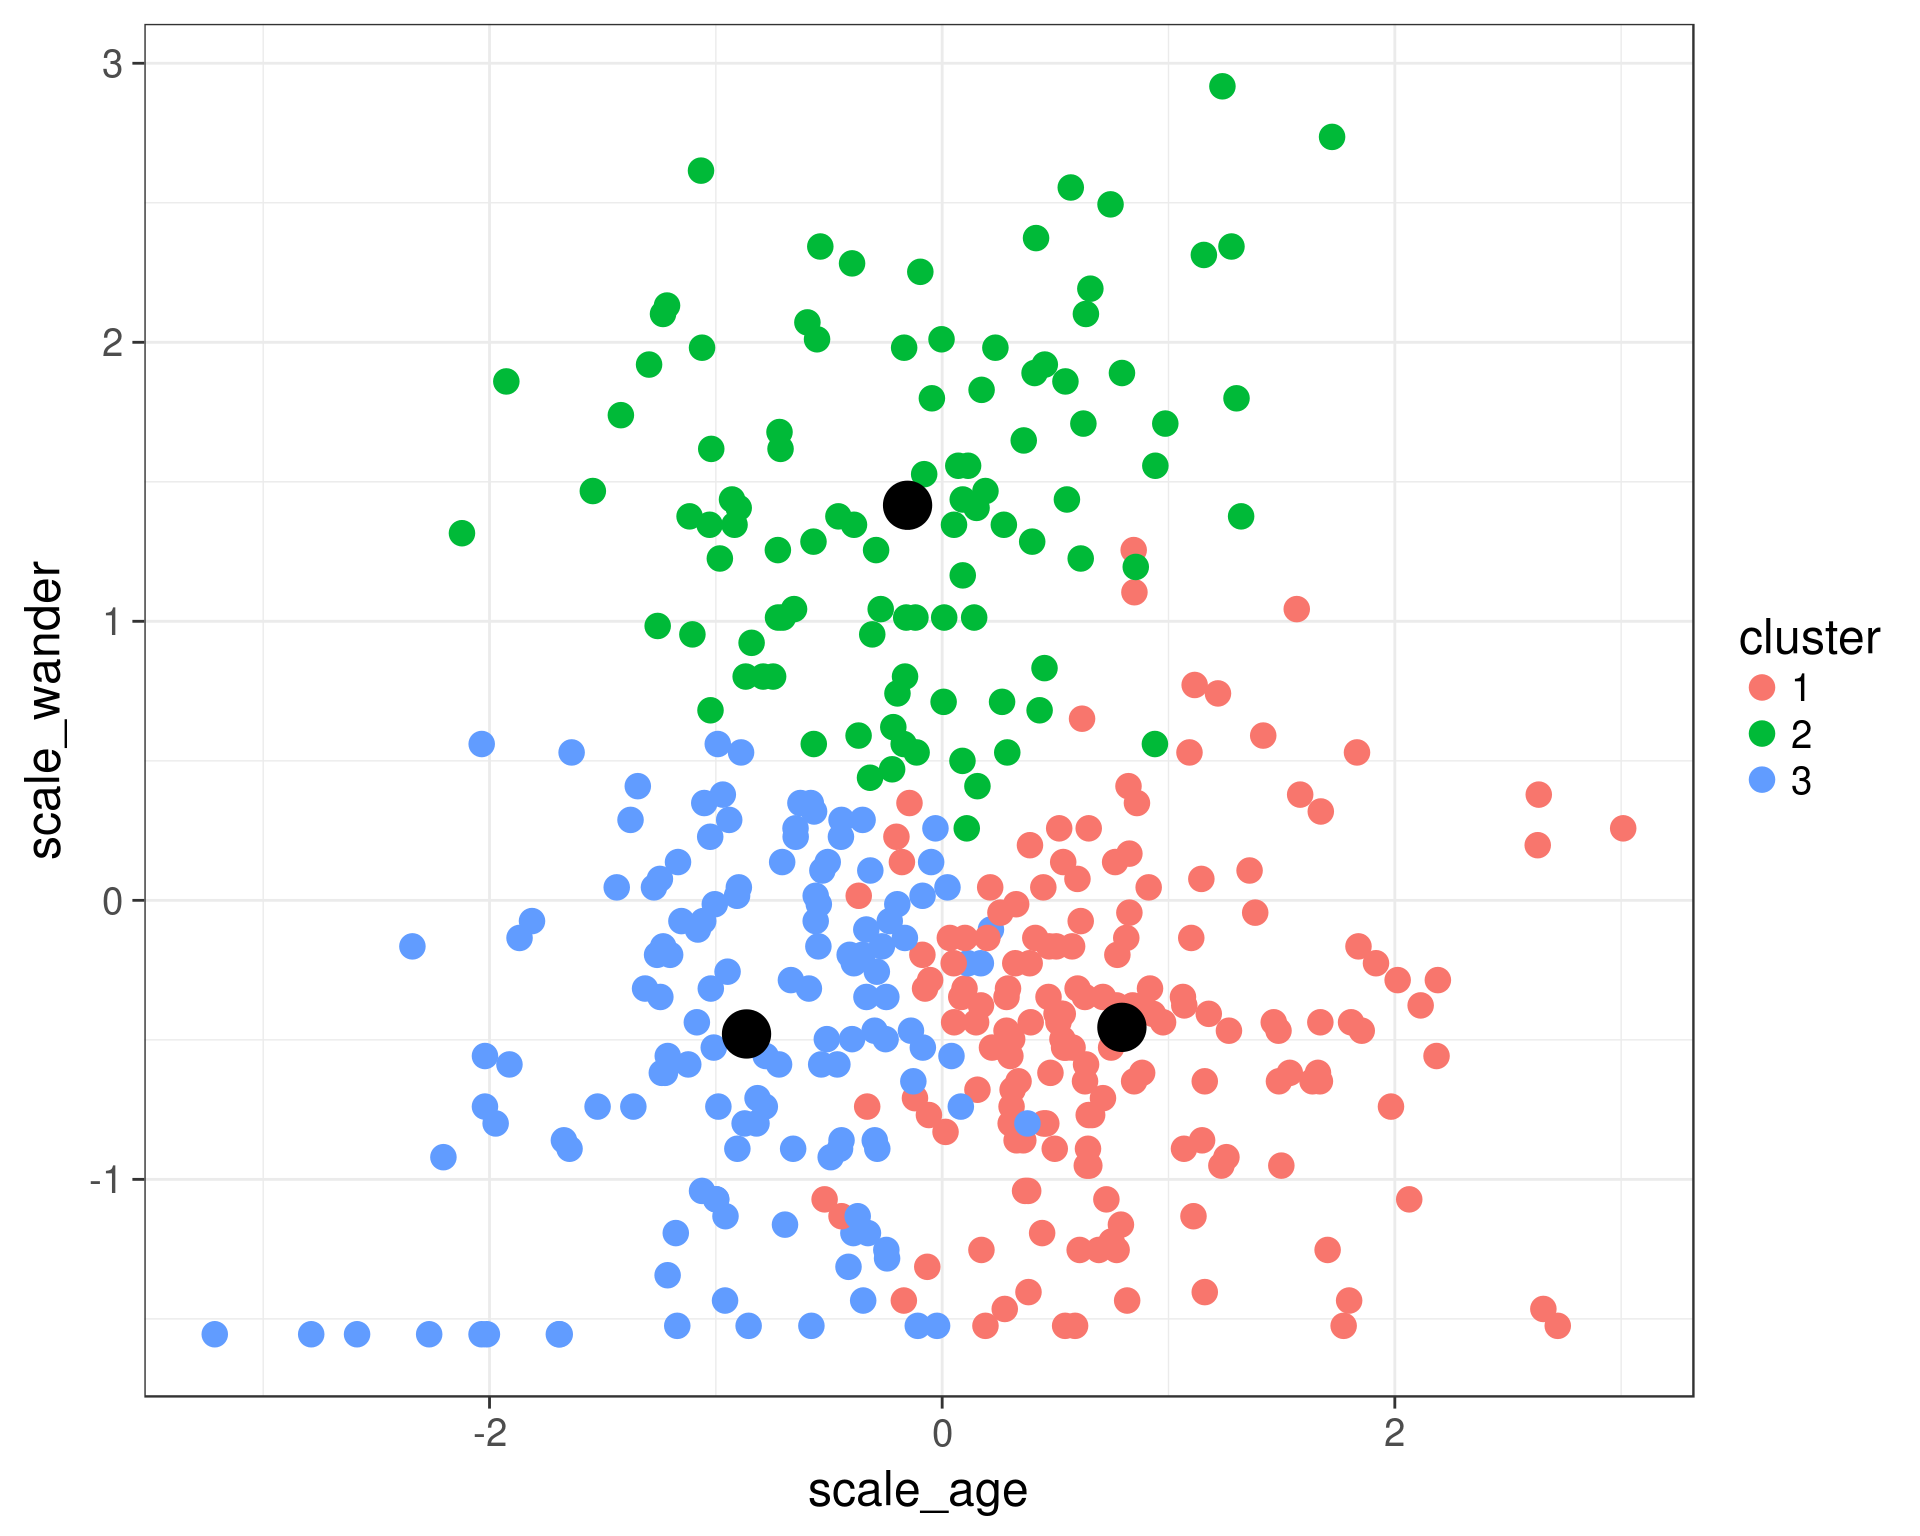
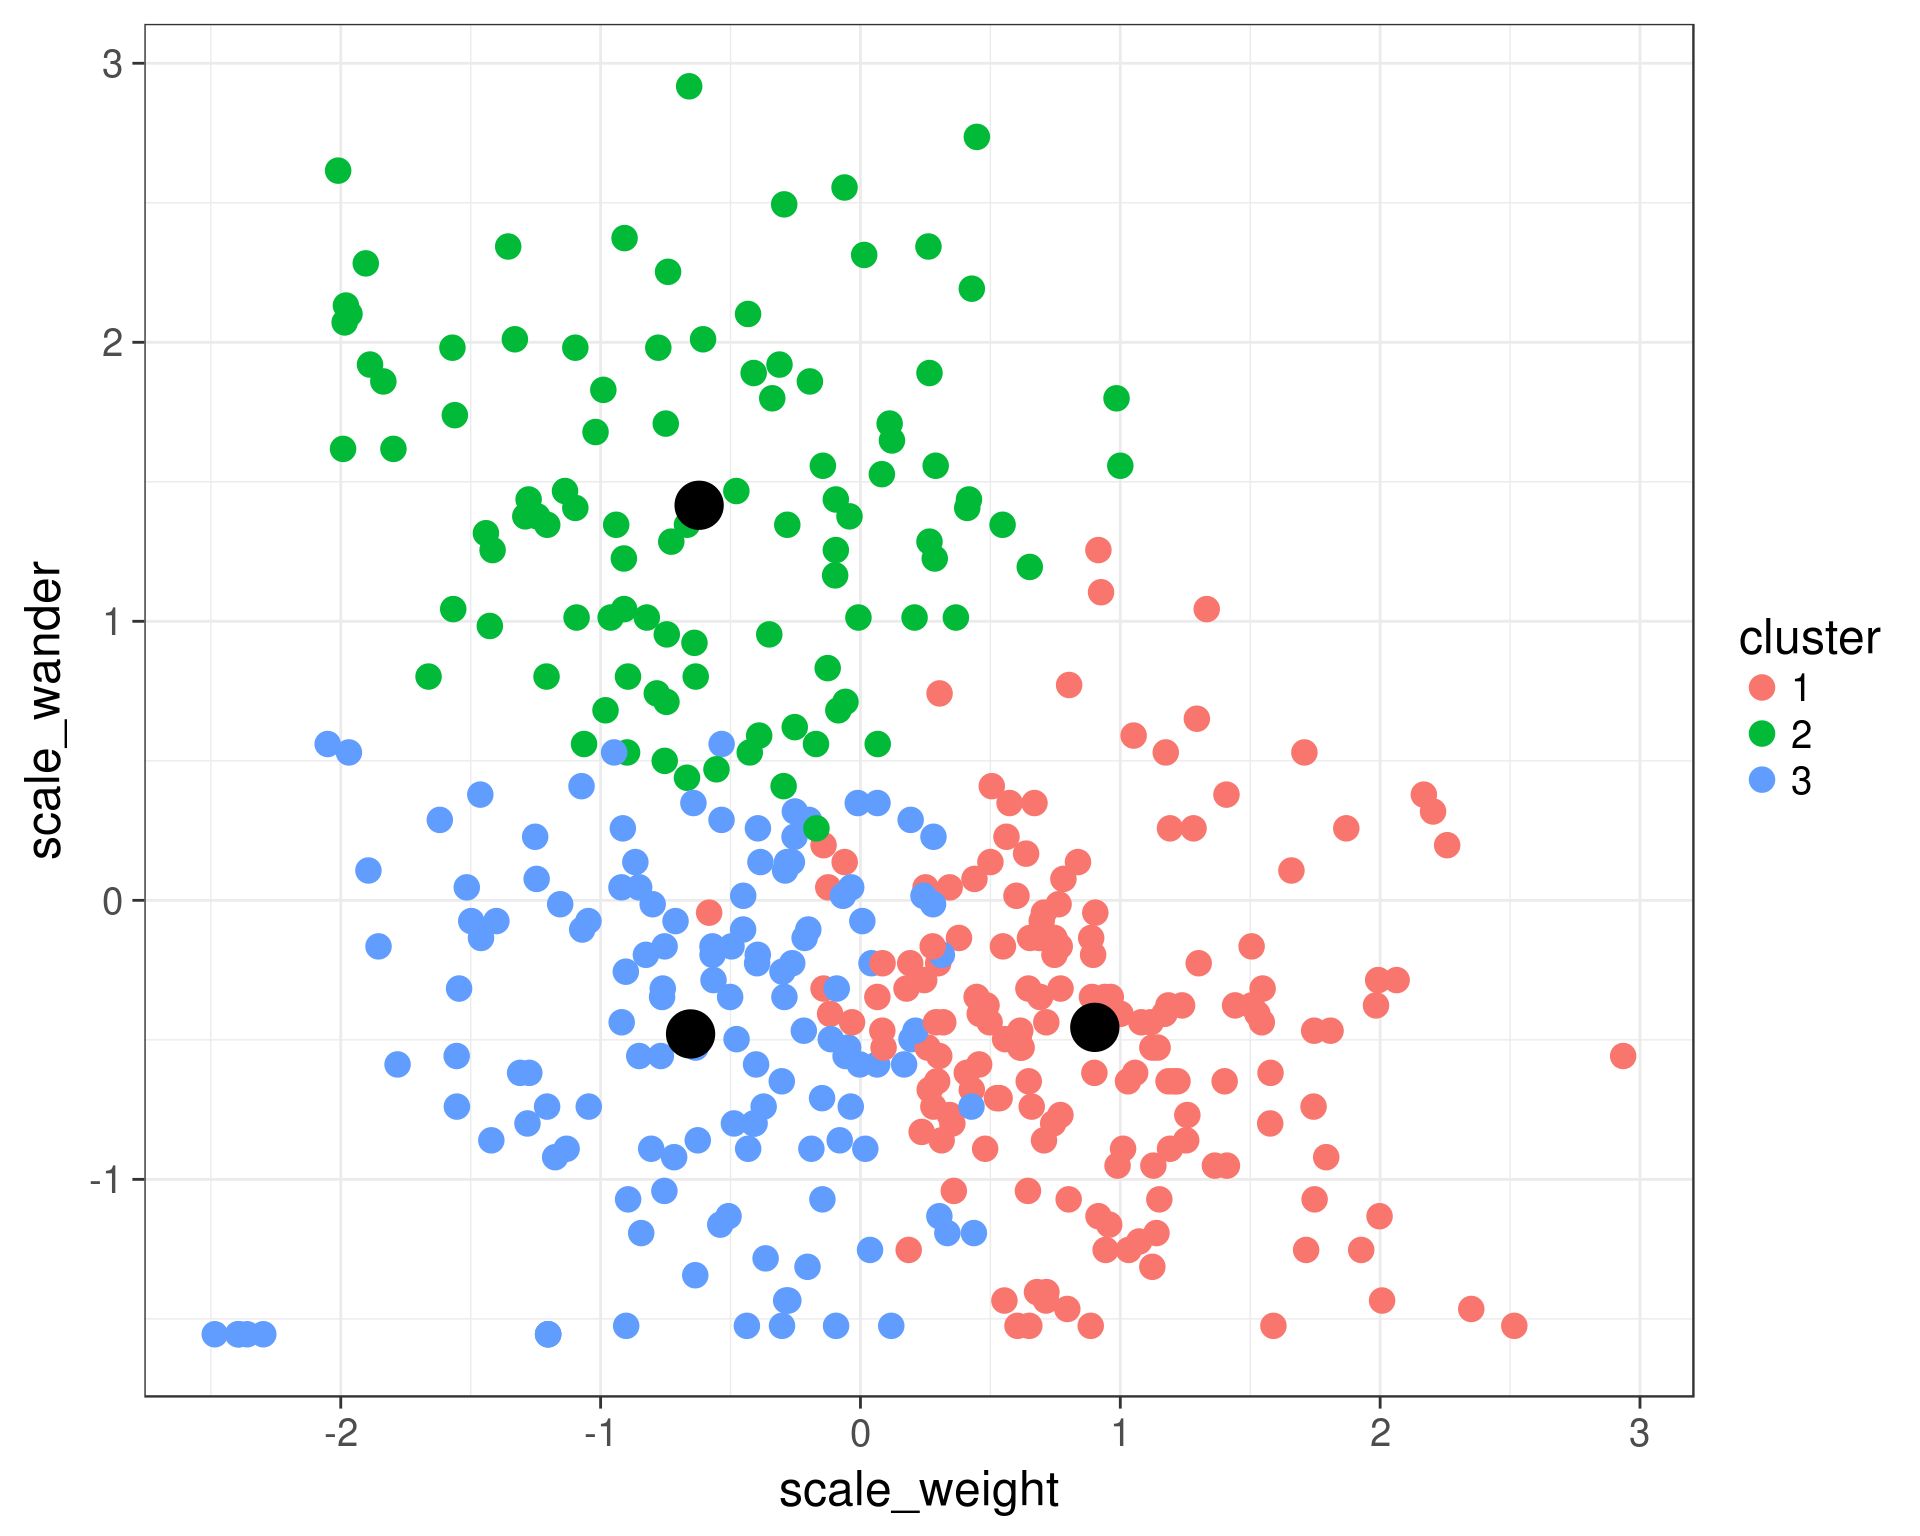
ggplot(data = cats) +
  geom_point(aes(x = scale_weight, y = scale_wander, color = cluster), size = 4) +
  geom_point(data = cluster_centers, aes(x = scale_weight, y = scale_wander), color = 'black', size  = 8) +
  theme_bw(base_size = 18)